Summary: This guide explains how to access the Tap dashboard directly from your Tithely account, view top-level performance metrics, and manage detailed analytics for your specific Tap disc batches.
Before You Begin
Navigation Note: Tap is only accessible via the dashboard widgets. You will not find it in the left-hand side menu or the top navigation bar.
Platform Consistency: Whether you are using the Tithely 2.0 or 3.0 dashboard, the entry method and the Tap dashboard experience itself are identical.
View-Only Metrics: The top-level dashboard metrics are informational snapshots meant for quick viewing; they are not clickable buttons or filters.
Step-by-Step Instructions
Navigate to your Tithely Dashboard. Log in to your account and ensure you are on the main dashboard screen (in either the 2.0 or 3.0 experience).
Click the Tap Widget. Locate the Tap widget on your dashboard and click it to enter the main Tap dashboard.
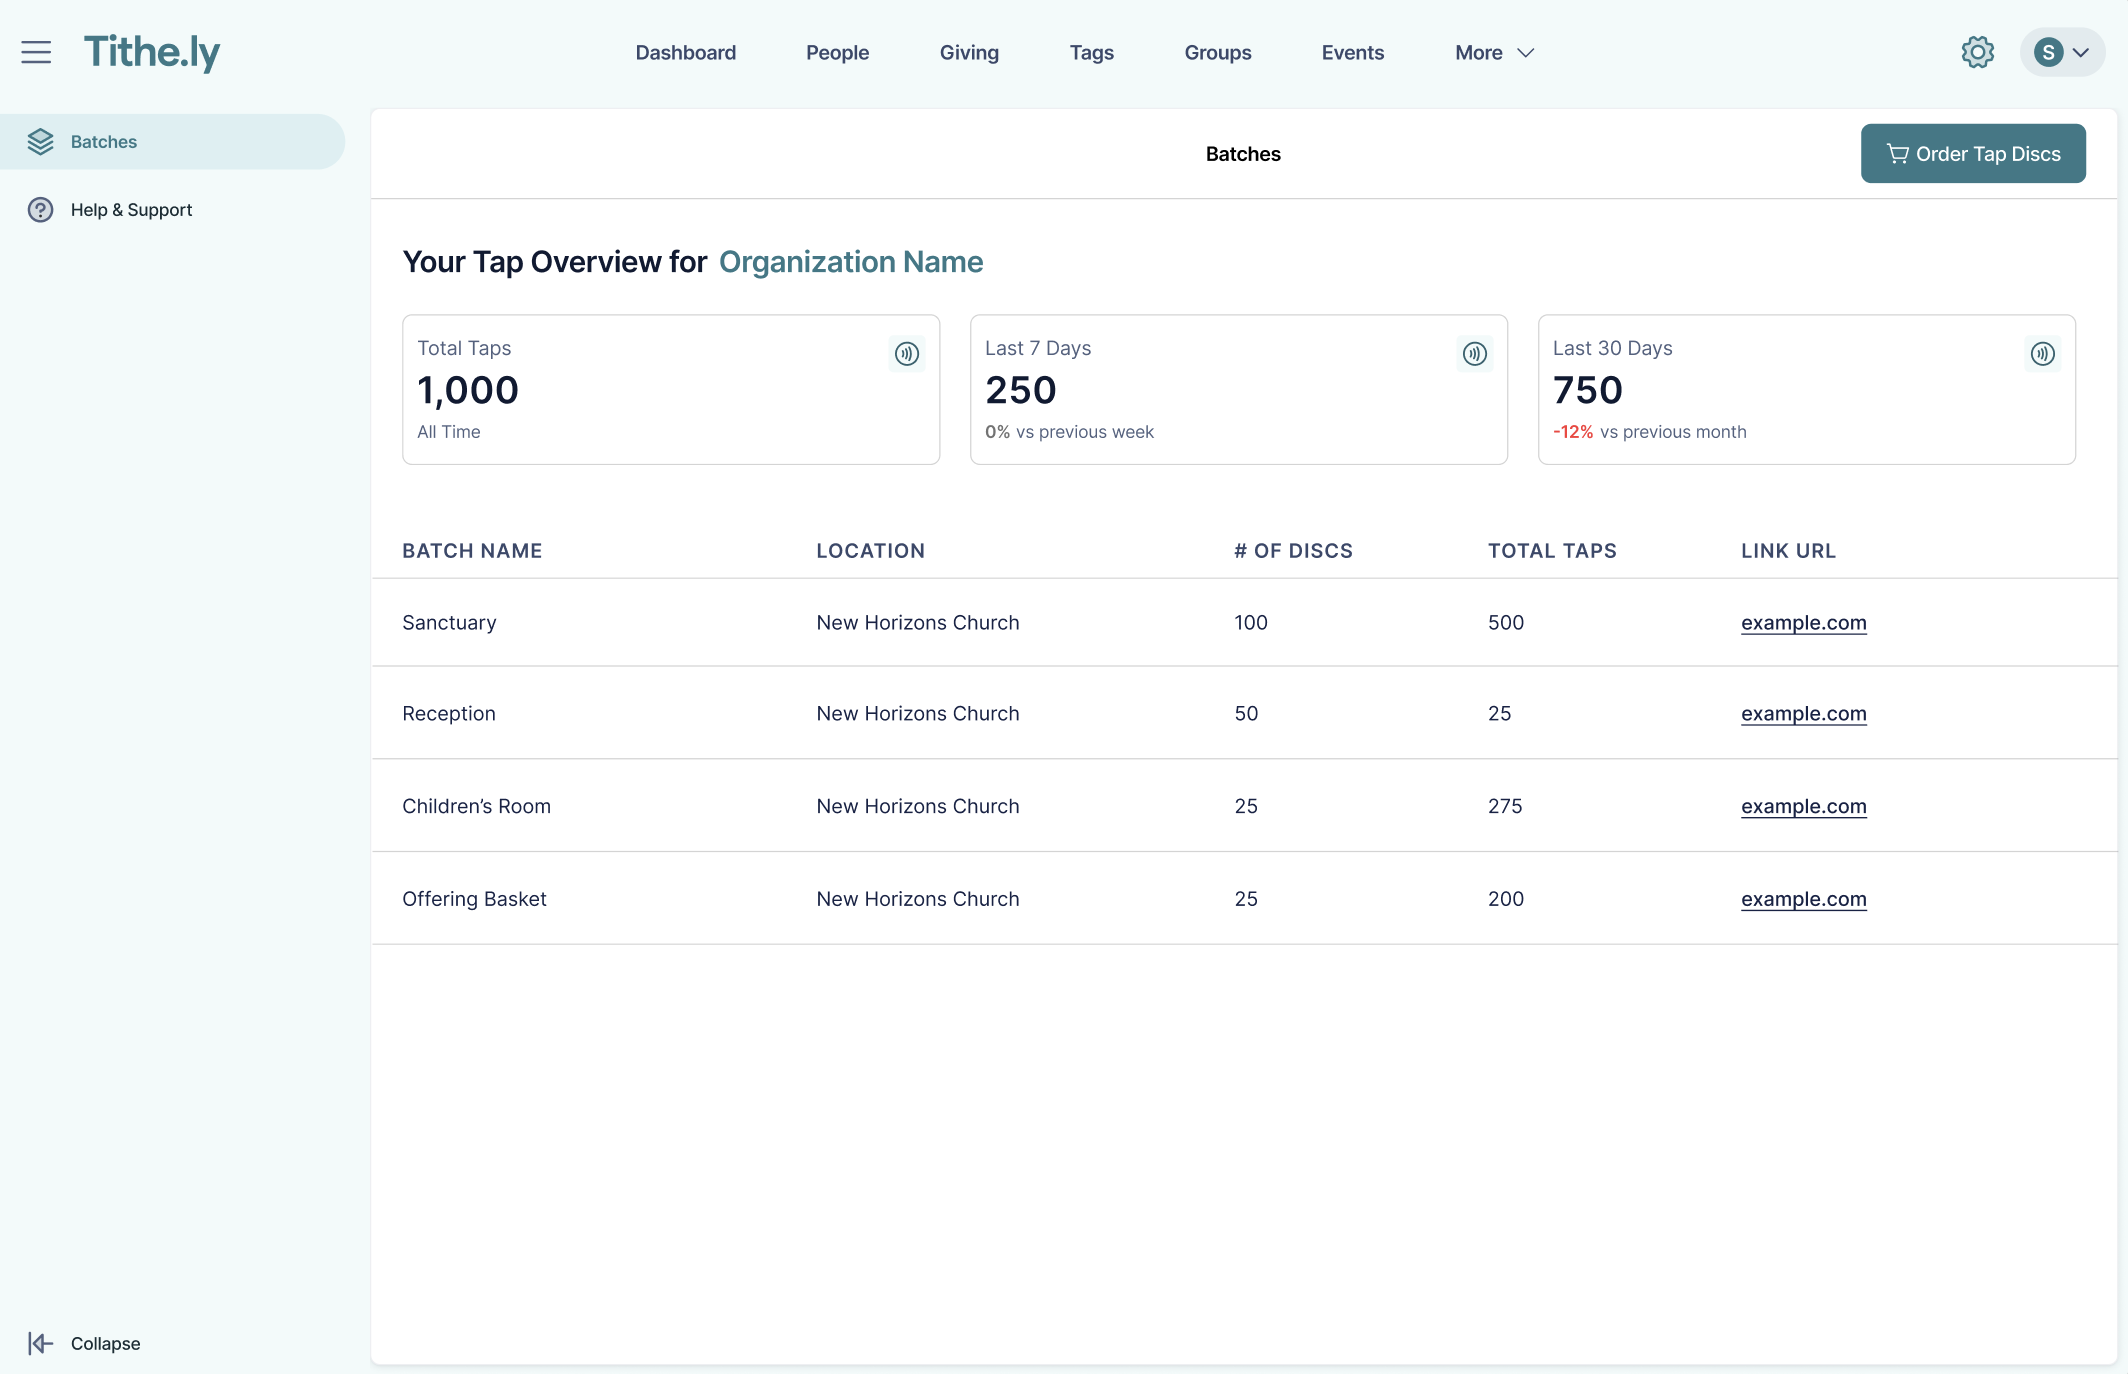
Review the Top Metric Modals. At the very top of your dashboard, you will see a section featuring three quick-glance summary cards:
Total Taps: The all-time total number of taps across your entire account.
Last 7 Days: Total taps recorded in the past week.
Last 30 Days: Total taps recorded in the past month.
Trends: Beneath the 7-day and 30-day numbers, you will see percentage trends indicating positive (green), negative (red), or even (grey) growth compared to the previous period.
View Total Taps per Batch. Scroll down to your list of Tap batches. You will notice a Total Taps metric displayed directly on each individual batch row, allowing you to see the all-time performance of a specific batch at a glance.
Select a Batch. Hover over and click on a specific batch (e.g., "Batch 2.2") from the list to open its details and deeper analytics.
Manage your Batch Settings. Once inside the batch, you have several options at the top of the screen:
Edit Link: Change the destination URL where the Tap disc redirects users.
Copy Link: Copy the destination URL to your clipboard.
Order More Discs: Click this to be taken to a custom product page to order more physical discs for this specific batch.
View and Adjust your Analytics. Scroll down to see your tap activity graph. The large number reflects the total taps for the timeframe you have selected.
Use the Timeframe dropdown to view data over the past week, month, etc.
Use the Grouping dropdown to group your tap data by day, week, or month.
Tip: Hover your mouse over the Graph to zoom in and see the exact number of taps on a specific day.
Troubleshooting & FAQs
Why can't I find Tap in my left-hand navigation menu? Tap is intentionally designed to be accessed only through the dashboard widgets. Even if you see it in a legacy tutorial video, it has been removed from the side and top navigation menus to streamline your workspace.
Why can't I click on the "Last 7 Days" card to change the date range? The three metric cards at the top of the dashboard are strictly view-only snapshots. To dive deeper and adjust date ranges, you must click into a specific batch to view its detailed analytics graph.
The numbers in my 7-day and 30-day boxes don't add up to my "Total Taps". Is it broken? Not at all! "Total Taps" represents the cumulative, all-time historical count for your entire account. Naturally, this number will be higher than the taps collected just within the last 7 or 30 days.
Does the analytics graph inside a batch show lifetime taps? The main graph and large number reflect the specific timeframe you have selected (e.g., "Over the past month"). To see your lifetime total for that batch, look at the "Total Taps" metric below the graph.
What do the other statistics below the graph mean? Below your main analytics graph, you will find a quick summary of your batch's lifetime performance. This includes the date of the First Tap, the Last Tap, the historical Total Taps, and how many physical Tap Discs are currently associated with this batch.